Spatial-Temporal Prediction
About
The construction of smart cities significantly changes urban management and services. One of the most fundamental techniques in building smart city is accurate spatial-temporal prediction. For example, a traffic prediction system can help the city pre-allocate transportation resources and control traffic signal intelligently. An accurate environment prediction system can help the government develop environment policy and then improve the public’s health. In this project, we propose several spatial-temporal prediction methods for regular regions, which will be introduced in this page.Methods
Deep Multi-View Spatial-Temporal Network (DMVST-Net) [1]
In DMVST-Net, we harness the power of convolutional layers and LSTM in a joint model that captures the complex nonlinear relations of both space and time. For further increasing the training data samples, we propose a local CNN method which only considers spatially nearby regions. In addition, we propose to use a graph of regions to capture this latent semantic, where the edge represents similarity of demand patterns for a pair of regions. Later, regions are encoded into vectors via a graph embedding method. In the end, a fully connected layer is used for prediction. The framework of DMVST-Net is: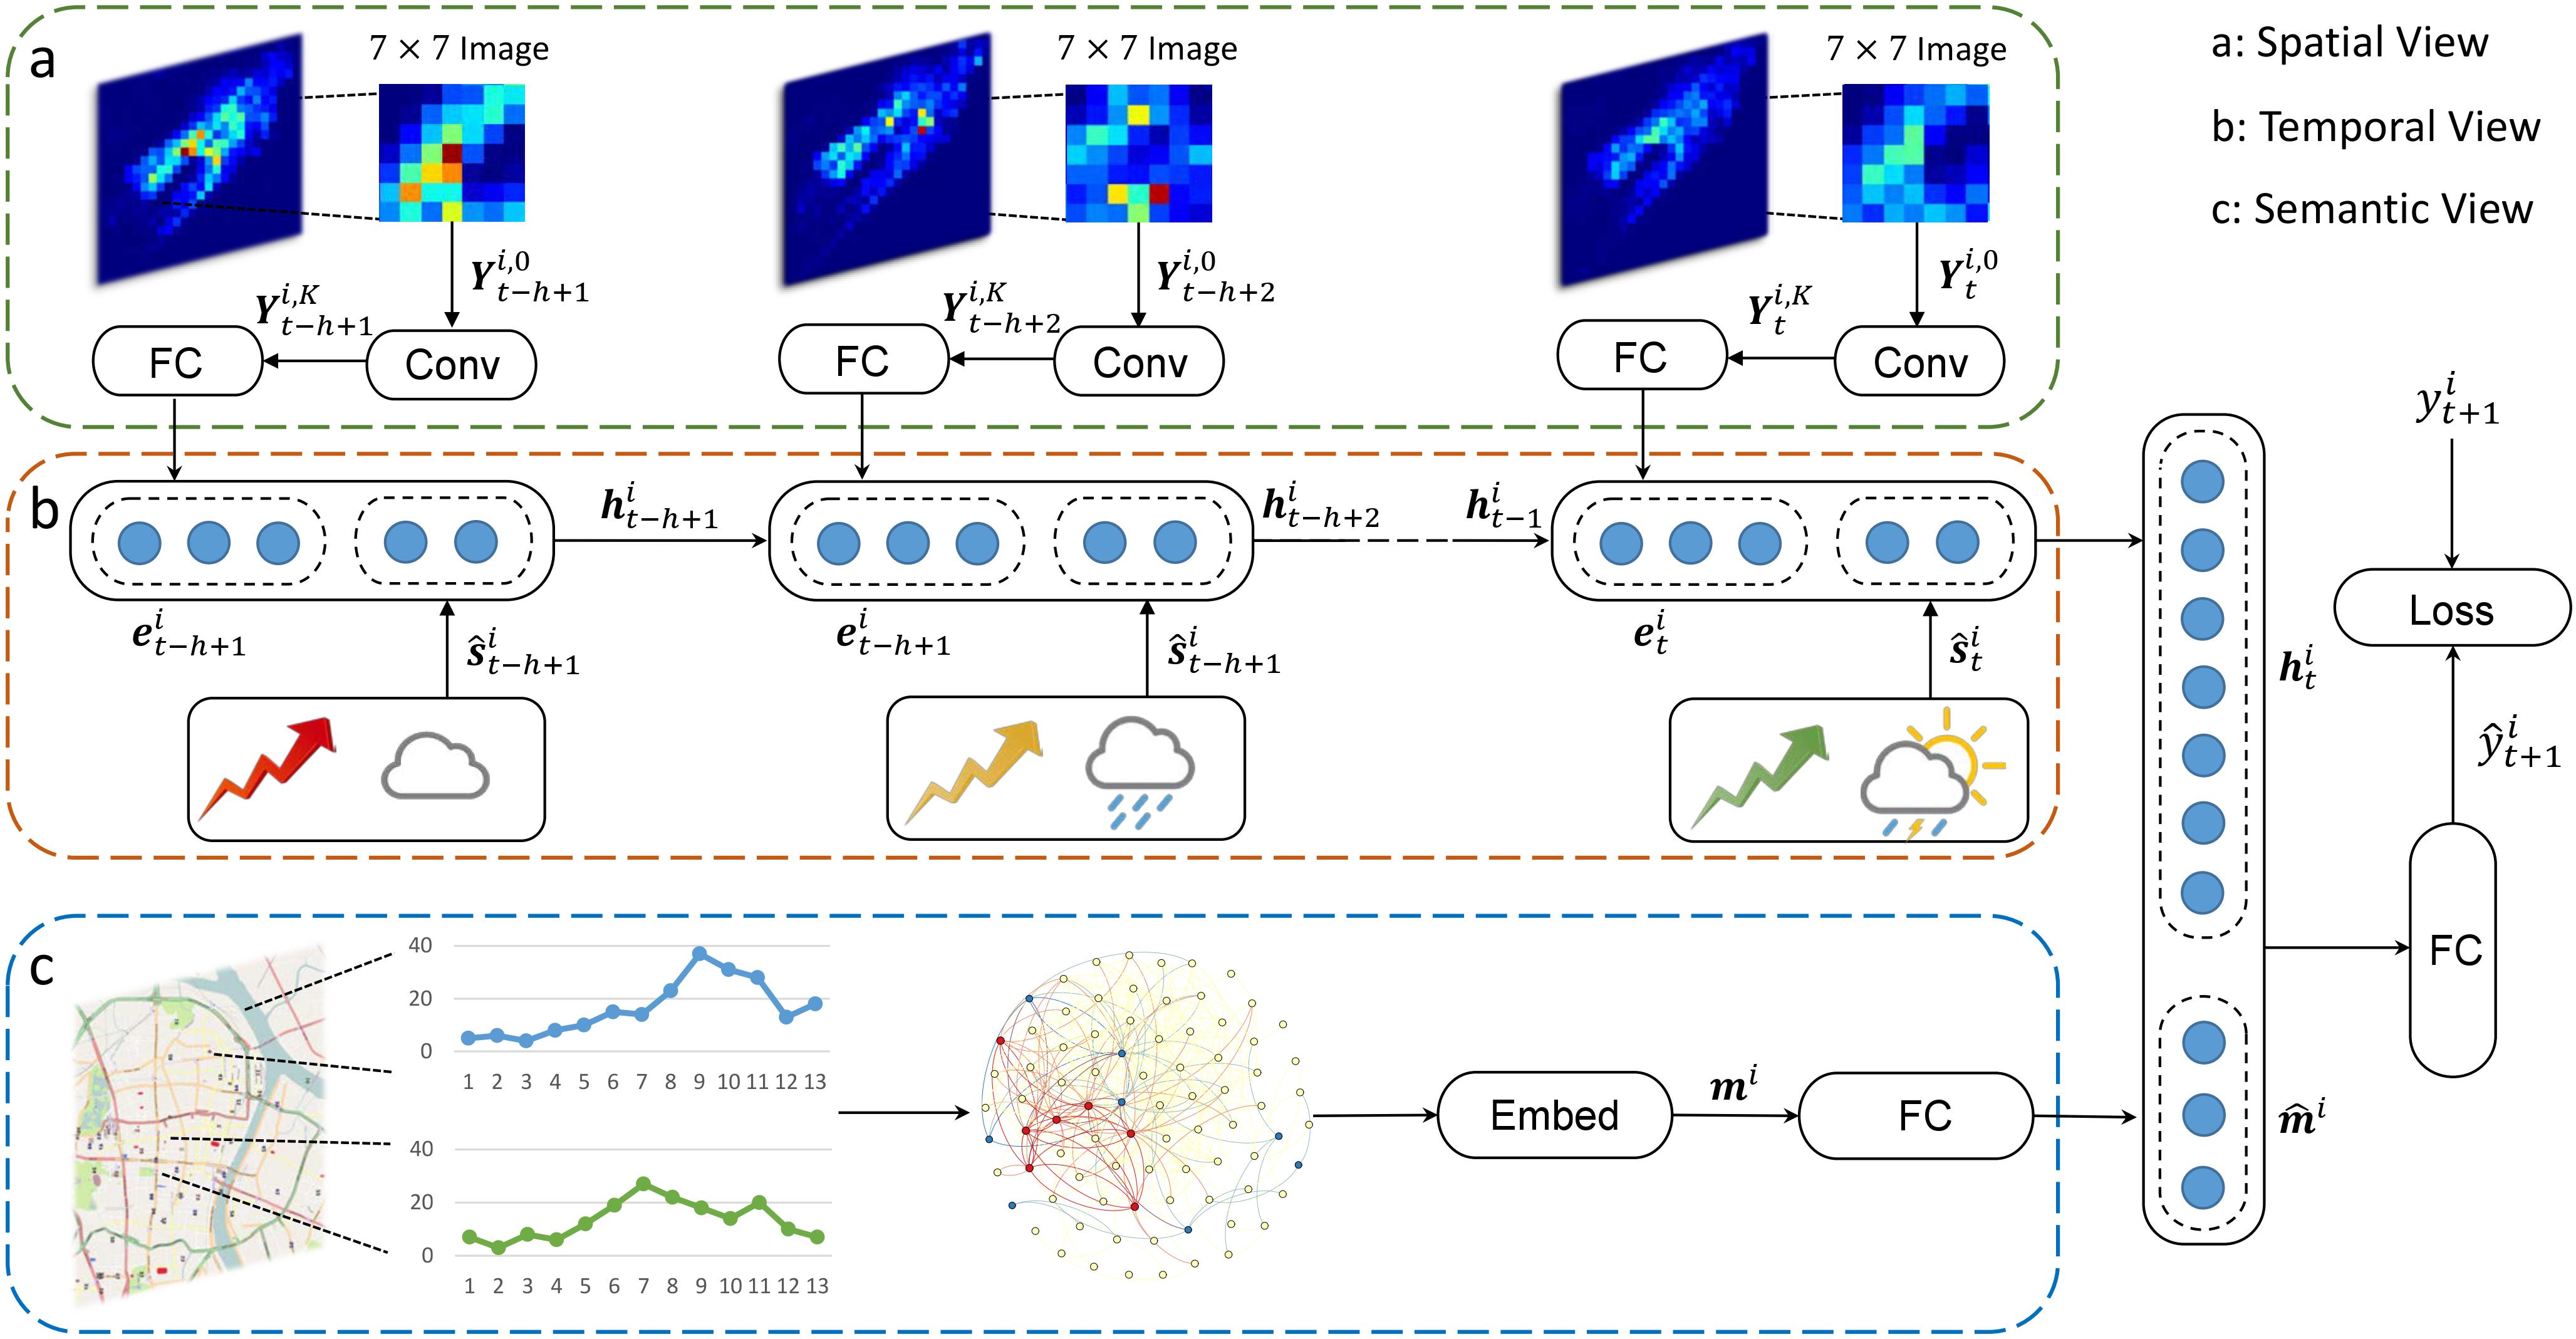
Spatial-Temporal Dynamic Network (STDN) [2]
To further consider spatial-temporal dynamic similarity, we further propose a new framework called spatial-temporal dynamic network (STDN). In this framework, a flow-gated local CNN is proposed to handle spatial dependency by modeling the dynamic similarity among locations using traffic flow information. A periodically shifted attention mechanism is proposed to learn the long-term periodic dependency. The proposed mechanism captures both long-term periodic information and temporal shifting in traffic sequence via attention mechanism. Furthermore, our method uses LSTM to handle the sequential dependency in a hierarchical way. The framework of STDN is: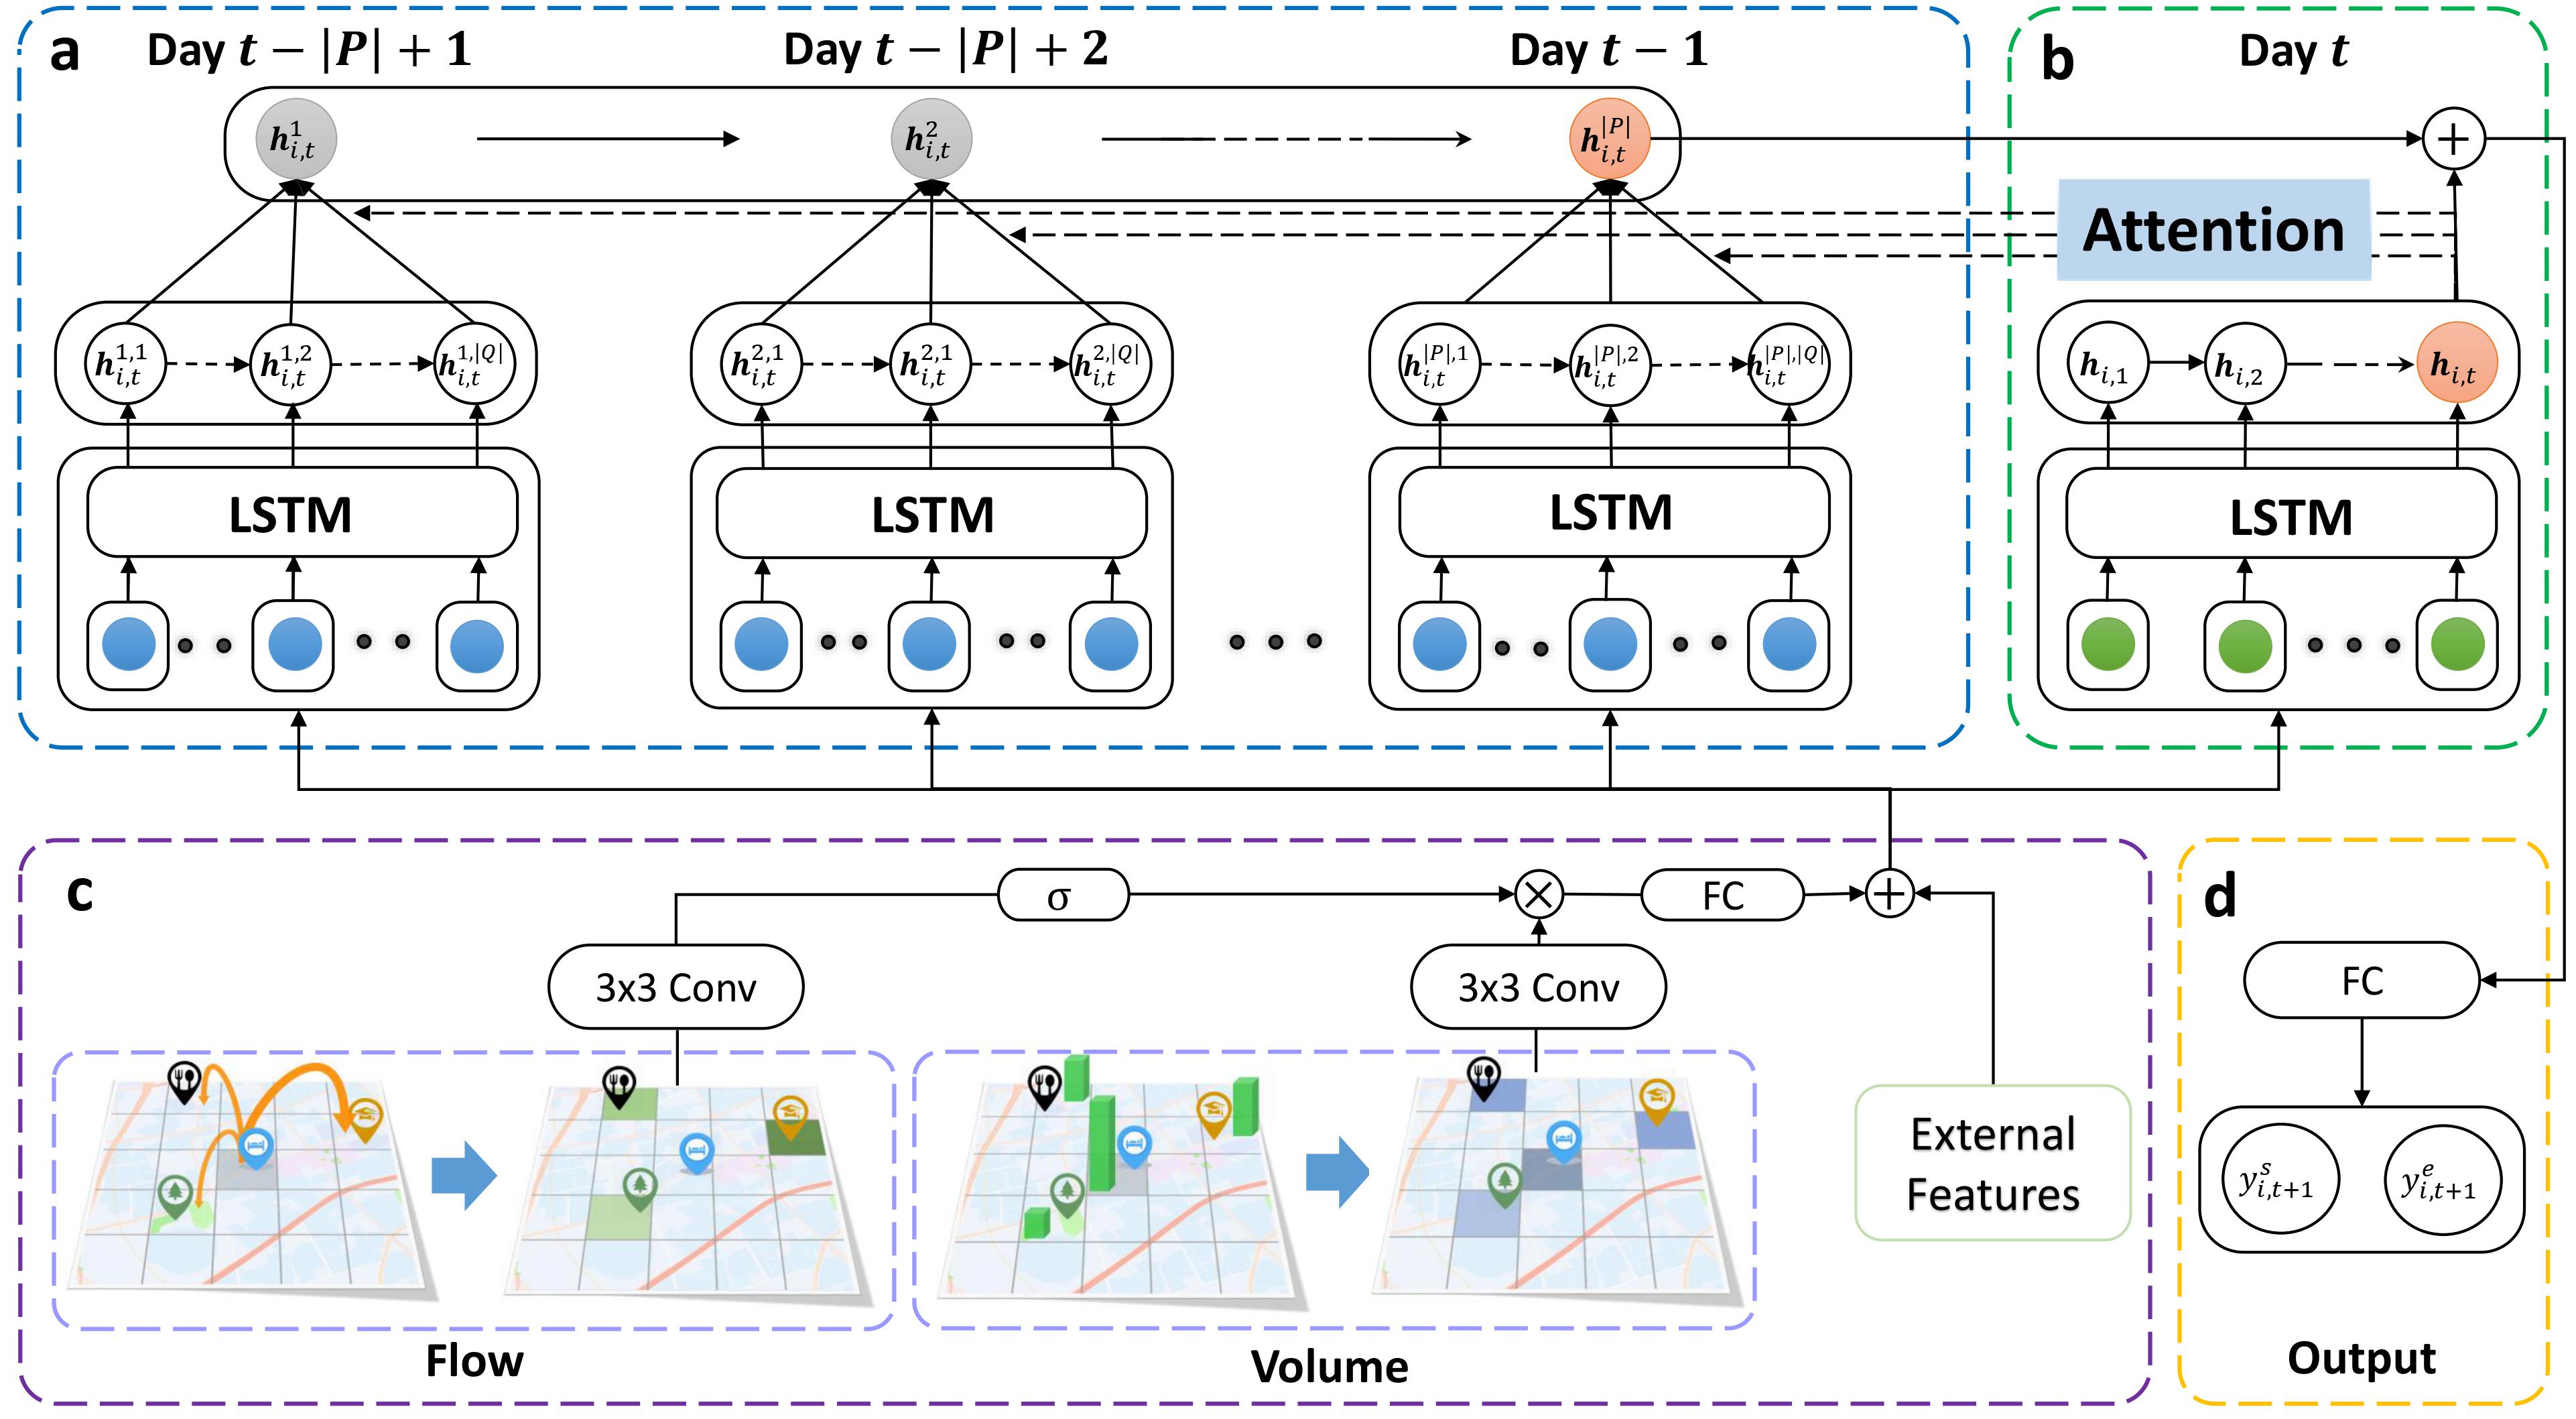
Meta-learning for handling few-shot spatial-temporal prediction (MetaST) [3]
The superior performance of these above spatial-temporal prediction models is conditioned on large-scale training data which are probably inaccessible in real-world applications. Thus, we further propose a new framework called MetaST to address the data insufficiency problem, by leveraging knowledge from those cities with abundant data. In this framework, we focus on transferring knowledge from multiple source cities for the spatial-temporal prediction in a target city to reduce the risk of unstable transfer. The framework incorporates the meta-learning paradigm into spatial-temporal networks. With the meta-learning paradigm, we learn a well-generalized initialization of the base learner (spatial-temporal network) from a large number of prediction tasks sampled from multiple source cities. Subsequently, the initialization can easily be adapted to a target city via fine-tuning, even when only few training samples are accessible. Second, we learn a global pattern-based spatial-temporal memory from all source cities, and transfer it to a target city to support long-term patterns. The framework of MetaST is: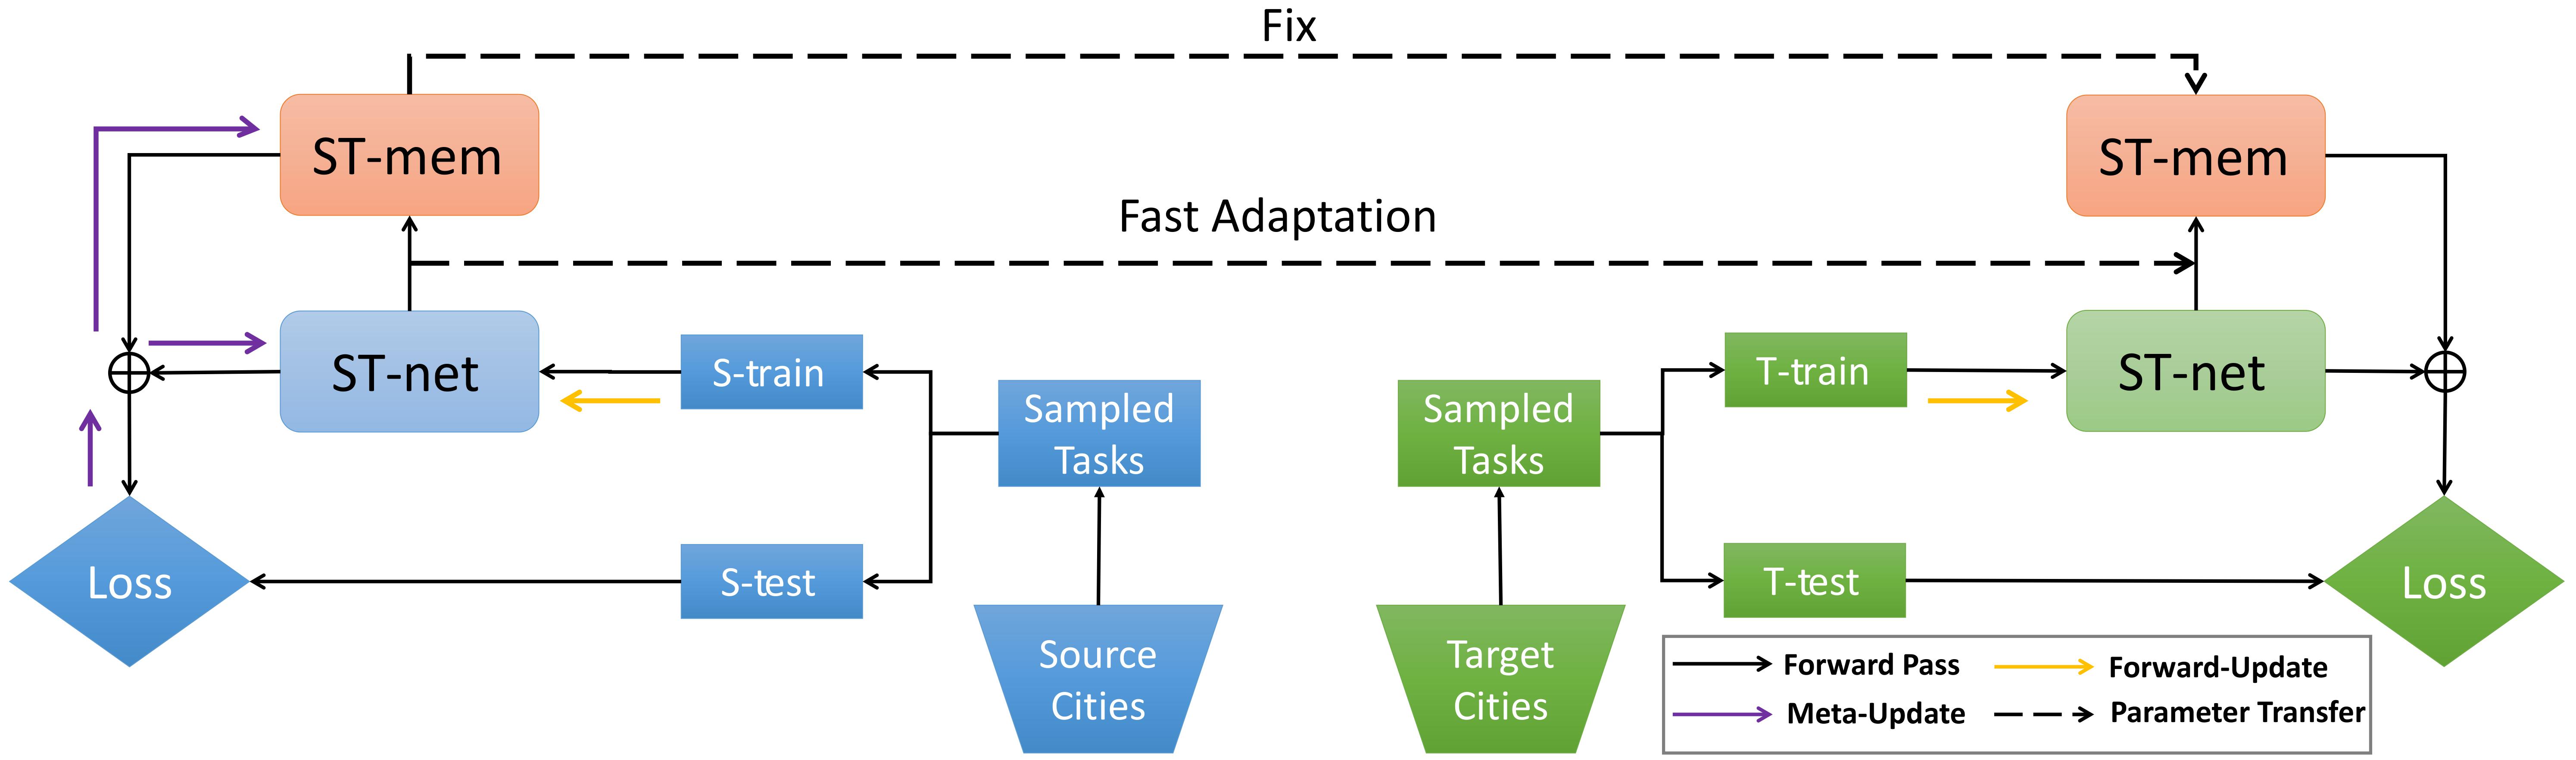
For more details, please refer to our papers.
Code
-
The code of DMVST-Net [1]: https://github.com/huaxiuyao/DMVST-Net
-
The code of STDN [2]: https://github.com/tangxianfeng/STDN
-
The code of MetaST [3]: https://github.com/huaxiuyao/MetaST
Data
DMVST-Net & STDN
We use New York Taxi and Bike data to evaluate the performance. For each dataset, we split the whole city as 10×20 regions. The data statistics are:| Data | Time | Trips |
|---|---|---|
| NYC-Taxi | 01/01/2015 - 03/01/2015 | 22,349,490 |
| NYC-Bike | 07/01/2016 - 08/09/2016 | 2,605,648 |
The two datasets are in: https://github.com/tangxianfeng/STDN
MetaST
We use taxi, bike, and pH value data to evaluate the performance of MetaST. The data statistics of taxi and bike datasets are:| Dataset | City | Time Span (m/d/y) | #Trips | Region Size |
|---|---|---|---|---|
| Taxi | New York City | 01/01/2015 - 07/01/2015 | 6,748,857 | 10x20 |
| Washington DC | 05/01/2015 - 01/01/2016 | 8,151,077 | 16x16 | |
| Porto | 07/01/2013 - 06/30/2014 | 1,710,671 | 20x10 | |
| Chicago | 09/01/2013 - 11/01/2014 | 124,820 | 15x18 | |
| Boston | 10/01/2012 - 10/31/2012 | 839,897 | 18x15 | |
| Bike | New York City | 01/01/2017 - 12/31/2017 | 16,364,475 | 10x20 |
| Washington DC | 01/01/2017 - 12/31/2017 | 3,732,263 | 16x16 | |
| Chicago | 01/01/2017 - 02/01/2017 | 106,165 | 15x18 |
The data used in this experiment is collected from the Water Quality Portal of the National Water Quality Monitoring Council. It spans about 52 years from 1966 to 2017. Each record represents one surface water sample with longitude, latitude, date and pH value in a standard unit. The continental U.S. area is roughly split to six areas: Pacific, West, Midwest, Northeast, Southwest, South. The map sizes of all the six areas are 25x50, 30x25, 35x25, 30x25, 50x25, 45x25, respectively
The three datasets are in https://github.com/huaxiuyao/MetaST/tree/master/raw_data
Evaluation
DMVST-Net & STDN
For DMVST-Net and STDN, we use New York Taxi and Bike data to evaluate the performance.Results (RMSE for NYC-Taxi):
| Method | Pick-up Volume (NYC-Taxi) | Drop-off Volume (NYC-Taxi) | Pick-up Volume (NYC-Bike) | Drop-off Volume (NYC-Bike) |
|---|---|---|---|---|
| ST-ResNet | 26.23±0.33 | 21.63±0.25 | 9.80±0.12 | 8.85±0.13 |
| DMVST-Net | 25.74±0.26 | 20.51±0.46 | 9.14±0.13 | 8.50±0.19 |
| STDN | 24.10±0.25 | 19.05±0.31 | 8.85±0.11 | 8.15±0.15 |
MetaST
For MetaST, we use taxi data, bike data and environment data to evaluate the performance.Results (RMSE for Chicago):
| Method | Pick-up Volume | Drop-off Volume | ||||
|---|---|---|---|---|---|---|
| 1-day | 3-day | 7-day | 1-day | 3-day | 7-day | |
| Multicity-Finetune | 2.18 | 1.89 | 1.60 | 2.20 | 2.08 | 1.69 |
| MAML | 2.01 | 1.78 | 1.52 | 2.10 | 1.92 | 1.66 |
| MetaST | 1.95 | 1.70 | 1.48 | 2.04 | 1.79 | 1.65 |
For more results, please refer to our papers.
Related Publications
-
[1] Huaxiu Yao, Fei Wu, Jintao Ke, Xianfeng Tang, Yitian Jia, Siyu Lu, Pinghua Gong, Jieping Ye, Zhenhui Li. Deep Multi-View Spatial-Temporal Network for Taxi Demand Prediction, in Proceeding of the Thirty-Second AAAI Conference on Artificial Intelligence (AAAI 2018), New Orleans, LA, Feb. 2018.
-
[2] Huaxiu Yao*, Xianfeng Tang*, Hua Wei, Guanjie Zheng, Zhenhui Li. Revisiting Spatial-Temporal Similarity: A Deep Learning Framework for Traffic Prediction , in Proceeding of the Thirty-Third AAAI Conference on Artificial Intelligence (AAAI 2019), Honolulu, Hawaii, Jan. 2019.
-
[3] Huaxiu Yao, Yiding Liu, Ying Wei, Xianfeng Tang, Zhenhui Li. Learning from Multiple Cities: A Meta-Learning Approach for Spatial-Temporal Prediction, in Proceeding of The Web Conference 2019 (WWW 2019), San Francisco, CA, May 2019.